Real-time Data about the Real Quit in K12: Winter 2022

One of the problems with data, and K12’s reliance on it, is that data ages. And ages quickly. But public education, especially, in its quest for accountability has established itself around officially reported data that states require from school districts periodically through the year. The complexities of collecting, auditing, reporting, and responding to district-reported data are significant, but perhaps not as significant as the consequences of the delayed reporting cycles that have been established over the years.
K12 education in the US is in the valley of those reports right now, and our ability to respond collectively to the stresses our students, teachers, and schools are under is hampered by the fact that many important attendance, discipline, and staffing reports won’t be due until after school is out in June. This has led to a significant gap in our understanding of how our schools are actually doing in 2021-22 and how we might be able to respond to potentially critical and time-sensitive issues in the school building.
K12Leaders touched on the significance of these gaps in a recent article (The Big Quit and the Problem with Big (and Old) Data in Education) which cites the radical differences between a Forbes and The 74 articles which paint both dire and simplistic pictures of where we are in regards to how our teachers are actually doing, and whether teaching, as a profession, is in crisis.
This has been a largely anecdotal conversation, at least as perceived by some… the “data simply isn’t in.” Though The 74 article does highlight the problem with data… it gets old fast. The data cited in that article, some from 2015, and some from as recent as 2019-2020, is profoundly out-of-date for our purposes of understanding what’s happening <right now> in our classrooms and school buildings.
Data collected from January 23rd through February 6th 2022 by K12Leaders describes the more immediate situation. Based on over 375 responses from across the country, here is the picture we see.
Who responded?
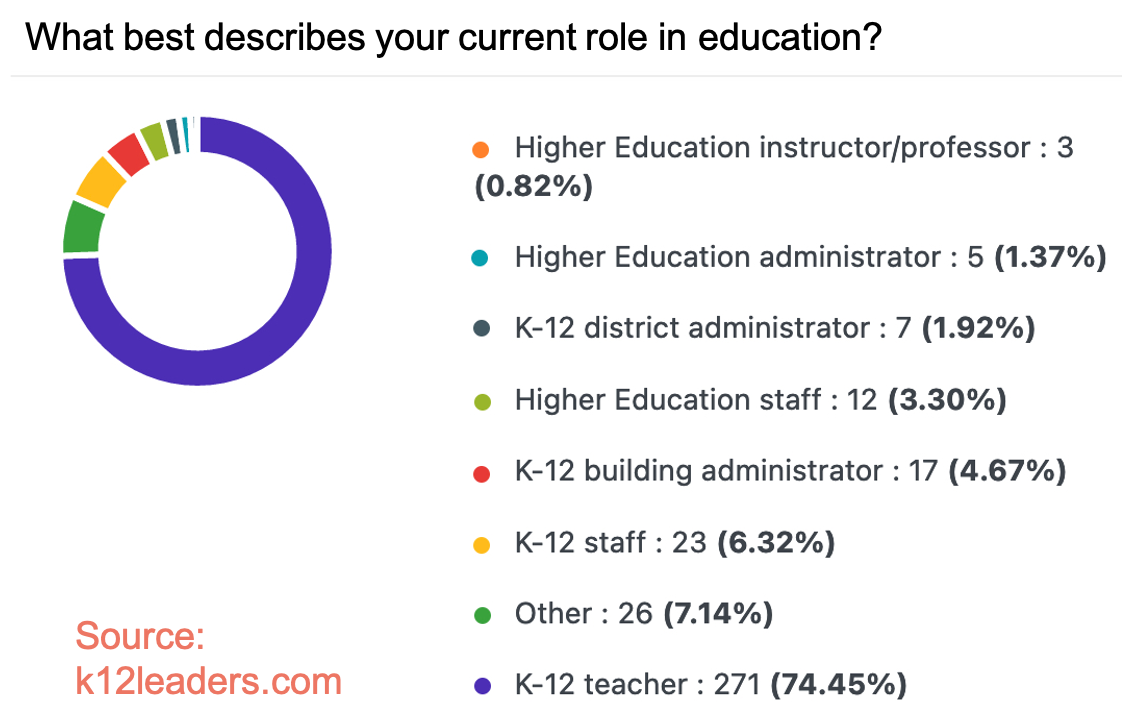
K12Leaders collected 364 responses between January 23rd and February 6th 2022. 87% of responses were from K12 staff, teachers, or administrators. Respondents spanned 38 US states.
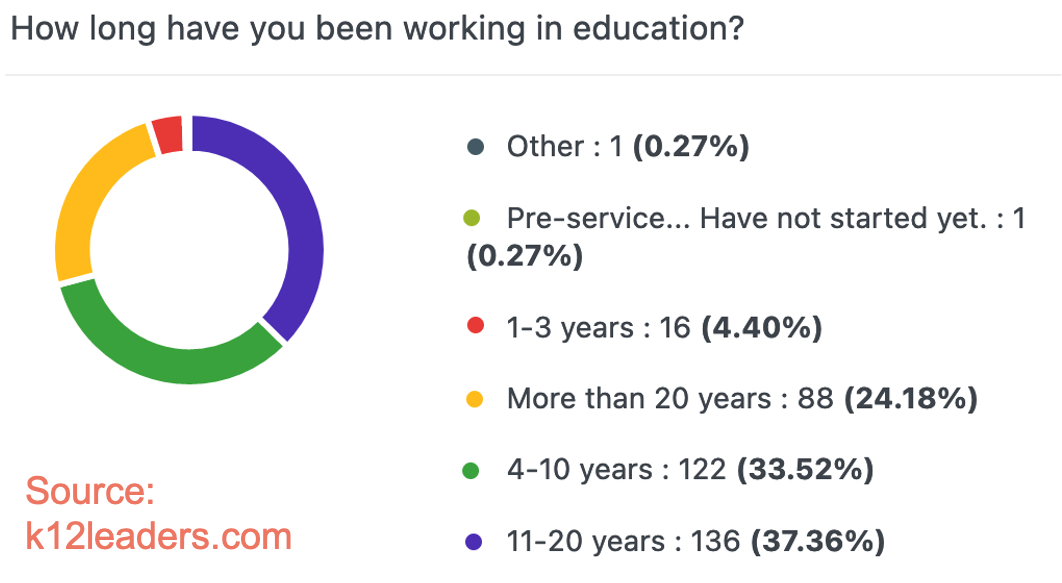
Respondents were experienced, with 95% reporting more than 3 years of experience in K12. Another question and response were somewhat redundant but supported these numbers… 75% of respondents are more than 10 years from retirement.
How seriously should we take recent stories of teacher dissatisfaction?
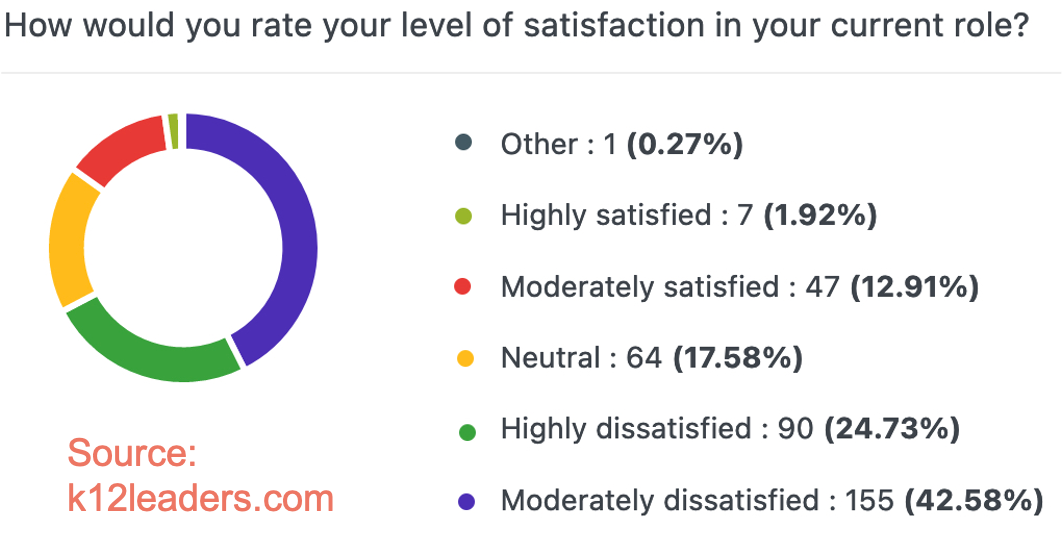
Over 67% of respondents report that they are “moderately” or “highly” dissatisfied in their current role.
How should we read the 67% degree of dissatisfaction? 88% of respondents report that they would give less than 1 month notice if they found another job.
Some good news is that over 60% of respondents indicate they would consider staying in education in a different role or district.
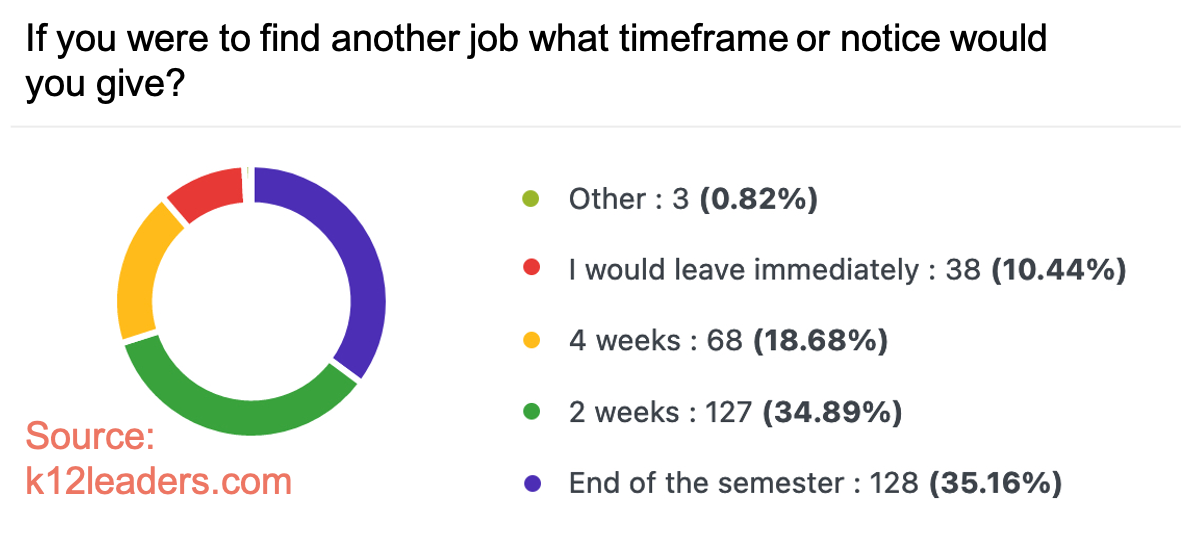
While 4 weeks notice may seem more than reasonable outside of education, educators are in the habit of announcing career moves well ahead of time. Retirements are deliberate and well-planned, and both teachers and administrators generally announce intentions to move-on in the spring before summer break. That over 10% of respondents say that they would “leave immediately” is unheard of.
The 4 most critical concerns…
We collected responses on 10 main concerns: Respect, compensation, benefits, flexibility, growth opportunities, community support, remote learning, pending retirements, personal concerns, and 4 sub questions about levels of response to Covid-19.
We have tallied all responses citing concerns of “moderate and above,” and labeled that percentage as a “risk factor.” Any “risk” over 60% is considered significant.
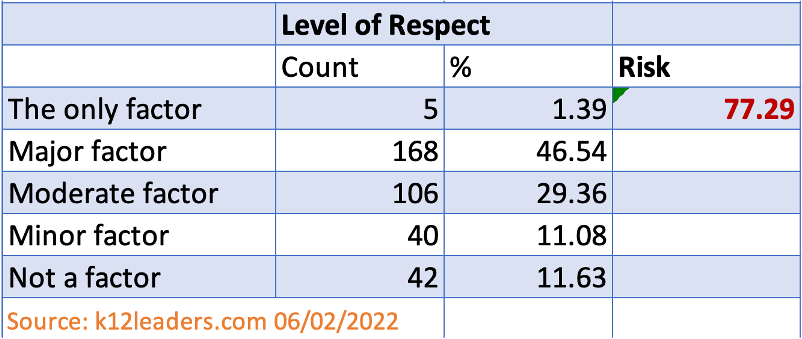
At the top of the list of concerns, is “Level of Respect” with over 77% of respondents stating that this was a moderate concern or higher.
Every year there is more expected of teachers and less respect for their expertise or opinion. The amount of data expected from teachers as proof they are doing their job is staggering and cannot be accomplished. Teachers are the only professionals expected to work for free, constantly pursue higher education for little monetary gain, and pay for materials out of their own pocket. All of these things used to be difficult to accept, but these, coupled with the attitude of most of society since Covid, that teachers are somehow the enemy, has made it an impossible occupation to want to be a part of.
Compensation was also at the top of the list of concerns, with over 74% or responses citing pay as a moderate or greater concern.
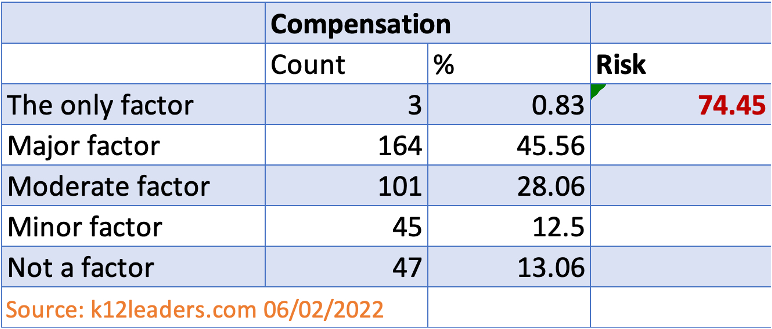
In a telephone follow-up with one educator, we uncovered some interesting details. It’s no surprise that teaching has a reputation as an underpaid profession, but what was surprising to this respondent was that many of the corporate jobs they’ve interviewed for pay significantly less than what they are currently making. With just over 15 years of experience, the customer support jobs they are interviewing for are paying between 30-50% less than they are currently making as a teacher.
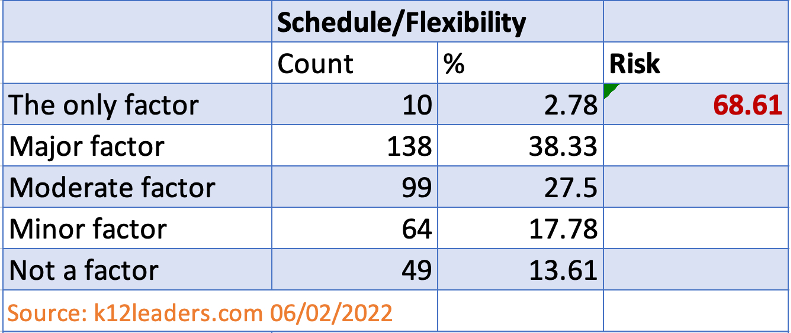
With almost 70% of respondents citing “schedule and flexibility” as a risk, additional questions come up. When, for instance, did educators start thinking about this question? Was this on educators’ minds before the pandemic?
Because of the lack of substitutes, required trainings that used to be a day with a sub to meet and train are now on-line trainings we must do on our own time and even though we are compensated for the time, it is hours and hours we have to do these on-line trainings outside of the work day.
65% of respondents cite a lack of professional growth opportunities, despite the frequent comments about the ongoing professional development demands put on them, as cited above.
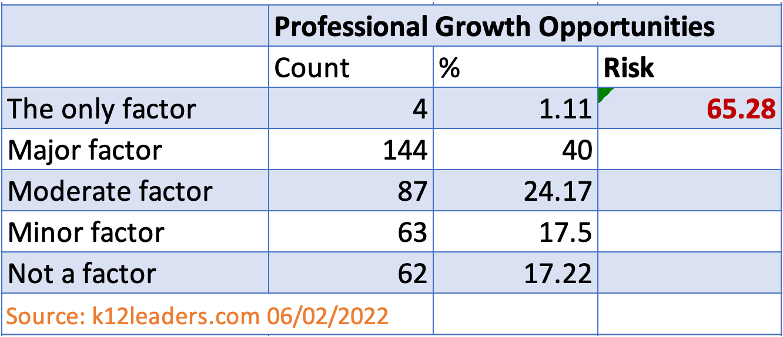
I don’t feel valued in our culture in a general way…. I will always be asked to do more and more and more with less and less. I don’t feel like I have room to advance and I definitely can’t afford to stay in a classroom long term. It gets worse each year. At this rate I will never be able to retire.
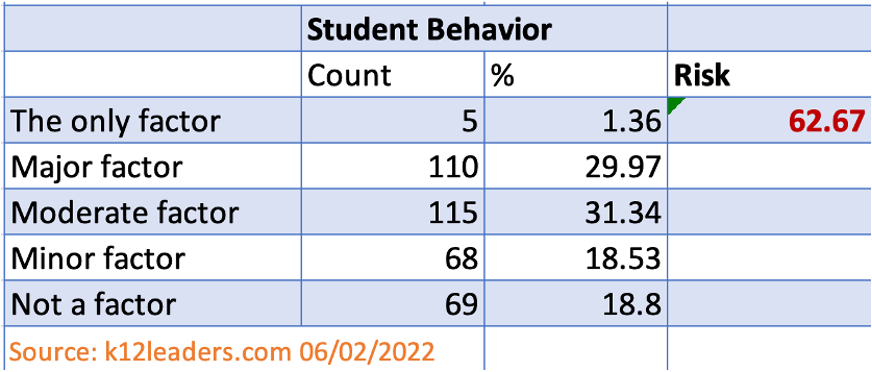
The number of detailed comments citing student behavior as a major concern makes this 62% seem like it under-represents the stress that extreme student behavior puts on educators.
The lack of support from administration regarding extreme student behaviors wears me thin. I am tired of being accused of not doing my job correctly when a student curses at me or throws things at me when all I did was ask the students to get a pencil, get to work, stop bothering someone, etc. I had a student cause a lockdown in my pod while he ranted and raved for 30 minutes, and the student wasn’t expelled…. I’m exhausted being expected to offer mental health services to students who need a trained professional’s help…. Above all, I am sick that I am not able to do what I love and what I trained to do- teach.
Another educator shares the following:
When I first started teaching 30 years ago, I had autonomy, support, and respect – and my students achieved. Now I have no autonomy, little support, and a complete lack of respect – coupled with the worst behavior, apathy and lack of work ethic in my students no matter how hard I try to make fun, rigorous, or meaningful lessons. I have 7 years to retirement and I’m not sure I’m going to make it…
Based on many comments, we see “parent/community attitudes” overlapping with the question about the”Level of Respect” educators are feeling. Certainly, anecdotally, we are hearing many concerns about parents and communities aggressively engaging with teachers and administrators in ways we’ve never expected. Just over 61% of respondents cited Parent and Community Attitudes as a moderate or greater factor in their stress.
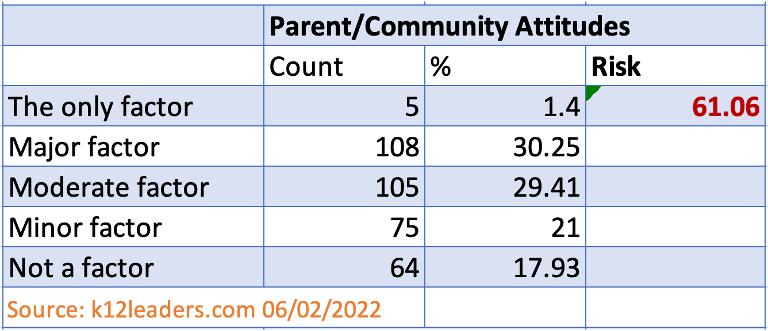
I have been teaching for 13 years and have a master’s degree in my field. I have never felt the hostility and disrespect that I have felt since the pandemic started. I would love to stay in education but move to an edtech position where I can still develop and plan engaging lessons, but be out of the physical classroom.
Tired of being the fall guy. Communities and local governments blame schools for trying to keep everyone safe. Common sense safety precautions are ignored in order to keep the doors open. Having everyone catch Covid is not the best way forward.
Other factors…
There were additional factors as well, but their risk decreases fairly rapidly.
- Benefits- 57% cite as “moderate or greater.
- Personal concerns- 44%
- Concerns about remote learning- 22%
- Planned retirement- 21%
And speaking of Covid…
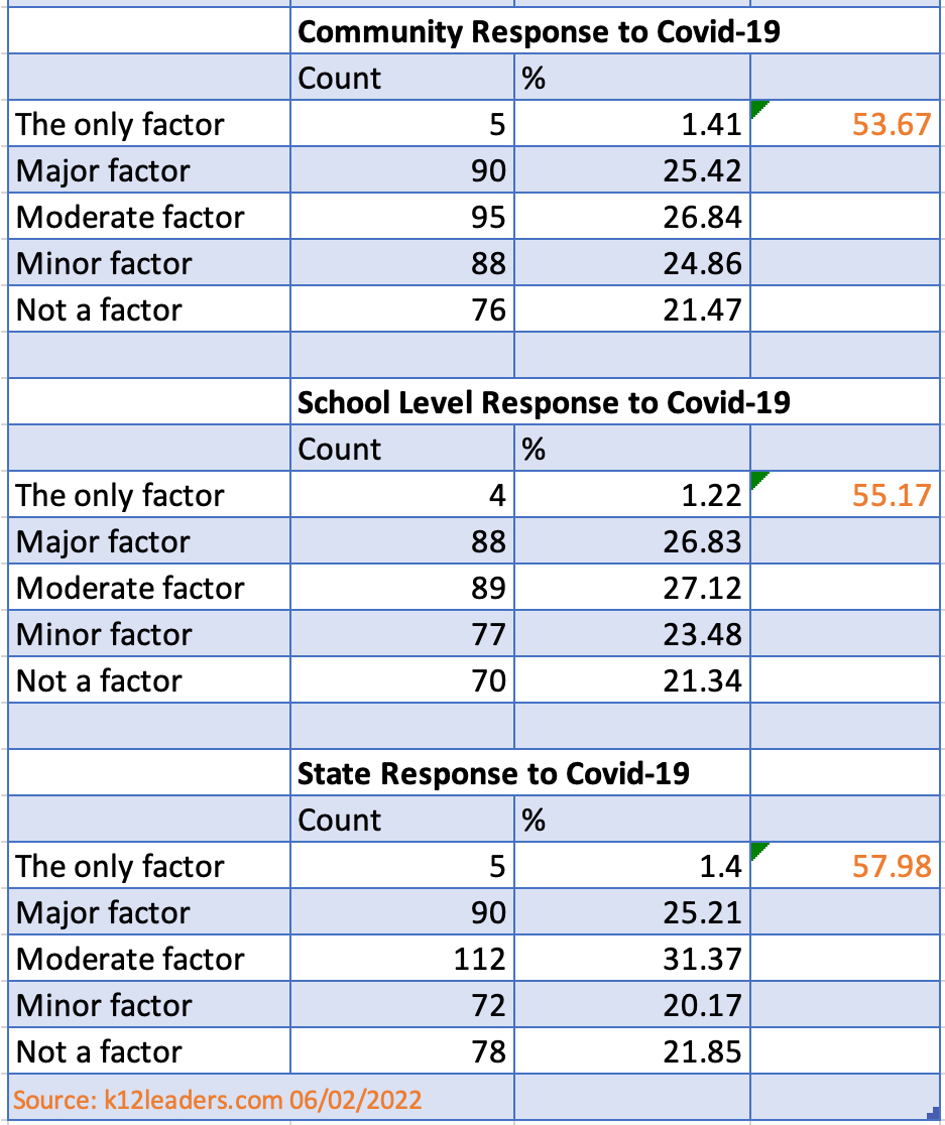
We posed 3 questions regarding concerns around the response to Covid-19 in three different scenarios. Local communities’ response, a school’s or district’s response, and the response to covid from the state.
While we were accounting for the possibility of some significant variance, we see that all responses rank Covid-19 as a moderate concern.
From comments, it’s apparent that Covid is seen as an aggravating factor that is contributing to educator’s stress, but is not universally seen as the driver for educators’ dissatisfaction.
Observations
We received a very high percentage of responses from K12 Teachers (75%) but only 6.5% of responses were from school or district administrators.
Reviewing free-form comments (some of which are quoted above) we recognize increasing frustration with the number of requirements put on teachers to meet state-level requirements. However, we also see significant and peaked frustration with direct supervision and the culture within schools and districts. Many responses call out their principals and superintendents directly for poor communication, micro-management, lack of support, and lack of respect.
Considering the highest risk factors captured by this survey, there are certainly a number of concerns that are outside administrators’ direct control. Pay-scales are policy and community driven. District leaders may be able to advocate for higher compensation, but to a larger degree their hands are tied.
Other factors, however, are directly within leadership’s control. School culture, respect, and student behavior all present opportunities for leadership. With more respondents from the administrator level, we hope we could provide better insight into these areas. As it stands, more research would be worthwhile to help districts prioritize their interventions to address what is clearly a crisis in the making.
Recommend0 recommendationsPublished in K12 Staffing and HR, Leadership Voices, State of Education


Responses